Your SaaS Venture’s Dashboard
Why do you need a dashboard?
Jon Sonnenschein, COO and Head of Product @RedboothHQ
It’s been a great ride here at Redbooth, disrupting a space that’s ripe for it — team collaboration. And, as we’ve grown, it’s been exciting and challenging to understand how the business is performing and to plan for our future. This article outlines how to build and use an operational dashboard to help drive your SaaS business.
Let’s be clear — this isn’t about data for data’s sake. We firmly believe the Drucker adage “If you can’t measure it, you can’t improve it.” I’m sharing the what, why and how of our dashboards in the hopes that it can help you build a great business, too.

What you need to know
Our dashboard starts with a view into:
- New customers
- Customer expansion (upgrades less downgrades)
- Cancellation
It distills these into three key areas that we monitor closely and helps us understand the levers we can move to drive the business. You’re welcome to copy this Google Sheet (all credit due to David Skok & Matrix Partners) and use it for yours, too. I’ll outline the key metrics in this section. The formulas are already built into the spreadsheet, if you’re not looking for definitions, rocket ahead to the next section (look for the gas station).
New Customers: CAC
What do you pay to get a new customer? That’s what Customer Acquisition Cost (CAC) estimates. This helps measure the efficiency and effectiveness of your sales and marketing efforts. It’s a simple formula:
CAC = Sales & Marketing Expenses ÷ Number of new customers
Using CAC: Months to Recover (Payback Period)
Using CAC and your average monthly revenue per account (ARPA), tells you how quickly your investments in Sales and Marketing are returned.
Months to Recover = CAC ÷ (ARPA x Gross Margin %)
Imagine a factory…
If a machine that produces $1,000 in widgets a month costs $100,000,
how soon will your factory enable you to buy another?
You’re looking for a 12-month benchmark here. If it takes longer than 12 months to get your CAC back, you need to tune your go-to-market strategy, you’re in danger of burning too much to grow.
Expansion & Churn: LTV
What’s your new customer worth based on how long you’ll keep them? That’s what Customer Lifetime Value (LTV) tries to answer. Just like CAC measures cost, this measures benefit — the revenue that enables you to become cashflow positive and profitable. It’s driven by your pricing, churn and customer expansion:
LTV = (ARPA x Gross Margin %) ÷ Net MRR Churn %
Have a low churn rate? Customers expanding organically? You’ve got a low net MRR churn and great business. Churn and burn ‘em? You’ve got a problem to solve and LTV is a good place to start.
Using LTV: CAC ratio
Divide your LTV by your CAC and you can see how many times a customer pays back your cost of acquisition.
CAC ratio = LTV ÷ CAC
Using our factory analogy again…
If the machine breaks down after ten years,
how many times will it pay for itself?
If your LTV/CAC ratio is below three, you probably have a churn problem, your machines are wearing out too fast!
Cash: Because it’s cash!
If I have to explain why you want to track your cash, you may want to reconsider your venture. Cash is the almighty. Yes, you have to understand your income statement, how revenues are trending, etc. But, if you’ve got a few months of runway, you’ve got bigger problems. Track your monthly change in cash, your ending cash and understand your runway.

How to fuel it
Start with the Dashboard Google Sheet (which you can freely copy and use).
Step 1: Get your New, New (new customer, new subscription) data
You’re looking for the key results of your new customer acquisition funnel. Since you’re selling SaaS, that’s new customers with their first subscriptions. Specifically, you want to collect:
- MRR and Total Contract Value
- Number of new accounts
- Total number of months paid upfront
Using Zuora, like we do, you can generate a custom report with:
- RatePlanCharge.MRR and .TCV
- Count of Subscriptions and total Subscription.InitialTerm
- Filtered by Account.CreatedDate, Subscription.ContractEffectiveDate and SubscriptionVersion = 1
These numbers go in rows 3–5 of the Inputs sheet.

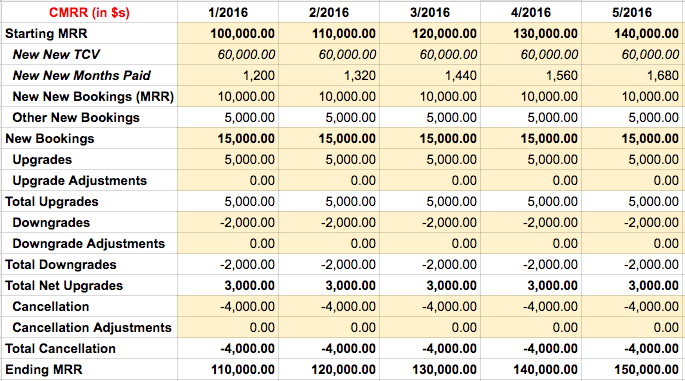
Step 2: Get MRR momentum data
Now, we add the main course, all of the segmented MRR data you’ve collected for the month:
- Starting MRR
- New Bookings (which include reactivations, etc.)
- Upgrades
- Downgrades
- Cancellation
The good news for Zuora users is that all of these data appear in the MRR Momentum extract. It’s easy enough to massage the report to get totals.
These numbers get entered into the remaining yellow cells on the Inputssheet.

Step 3: Enter your other financial data
On the OpMetrix sheet, enter the additional revenue, expense, and cash data from your financial statements into the Summary Financial Metrics and Cash sections.
Extra credit: Get your other key operating metrics in here!
Track precursors to the metrics, like your customer acquisition funnel, your customer engagement and their satisfaction with your service. Again, you’ll find these highlighted in the OpMetrix sheet.


How to use it
If you’ve read this far, you know:
- Why you want a dashboard
- What to measure
- How to collect key data to populate it
Here’s how we apply it at Redbooth. Every quarter we do a deep dive on our metrics, starting with our revenue, cash and unit economics. We start top-down looking at performance against our key objectives and then driving deeper to identify the drivers we want to tune.
It’s similar to the McKinsey problem solving method like Kenichi Ohmae outlined in The Mind of the Strategist.
If your CAC payback is too long, pick apart the formula…
Are you getting enough new customers?
Then, continue working back up the funnel — Is your conversion from trial meeting benchmarks? You trial activation rate? Your visitor to trial conversion
Your goal is to reach the set of Mutually Exclusive, Collectively Exhaustive drivers, and to align your initiatives with impacting specific targets.

Is your LTV too low? Are you plagued by high churn or little expansion?
Backing up to customer engagement and happiness can help you gain insights and drive your business better.
Review trends in the number of support requests you get, your customers’ satisfaction with support, your Net Promoter Score and build your own index of relevant customer engagement (similar to Daily/Monthly Active Users).
Segment the data by user type, and cohort and look for trends in their engagement, happiness and net churn.

On a monthly basis, we review the results of our initiatives and the interim results of the business. It’s a valuable checkpoint to ensure we’re seeing the results we expect, to review priorities and to trade-off initiatives. We maintain our initiatives in plain-sight for the entire team to promote alignment, transparency and ownership.
We’ve had great results tuning and driving our business off our dashboards and initiatives. It’s helped our team focus on what counts, reducing our CAC payback by 50% and increasing our LTV/CAC ratio by 5x in just six months.
Thanks for your interest. With the right tools, team and focus, you can drive exceptional results in your SaaS business too.

Resources
If you’re reading this, you’re probably already aware of the breadth of resources to help you benchmark and drive your SaaS business. We built our dashboards by synthesizing these sources and discussions with VCs. Here’s a quick recap of our sources.
- Matrix Partners’s blog: https://medium.com/for-entrepreneurs
- SaaStr Academy and Annual: https://www.saastr.com/
- Pacific Crest Securities SaaS Survey: http://www.pacific-crest.com/2015-saas-survey/
- Tom Tunguz’s (of Redpoint Ventures) blog: http://tomtunguz.com/
Special thanks to Justin Label and Anoushka Vaswani
Note: We have key parts of our dashboards automated through RJMetricsPipeline and Chartio. If it’s of use, we’ll take a cut at describing our real-time dashboards too.